The Number Cruncher
for SQL Server!
"Total
SQL Statistics can help your VB application deliver data quickly from
your database to your consumers without having to re-enter or transform
it."
- John Pearson, Visual
Studio Magazine
Rave Reviews

|
NET Ready
|
|
|
Total SQL Statistics Product Guide
Product Highlights
Powerful Statistical Analysis of Microsoft SQL Server Data
Go beyond the basic analysis of SQL queries. Total SQL Statistics
offers a wide range of statistical functions to analyze your Microsoft
SQL Server data. Data in tables, views, stored procedures, and user
defined functions can be analyzed with the results in tables giving
you maximum flexibility in working with these data sets.
Analysis scenarios are designed by running our interactive Scenario
Designer program. Easily select the data set, fields, and analysis to
perform. The settings are automatically saved. Run the analysis
interactively to verify it's what you want. Then add it to your Visual
Basic and Visual Studio .Net applications with a simple call into a
distributable run-time library. Generate powerful statistical analysis
without your users even knowing Total SQL Statistics is running in the
background.
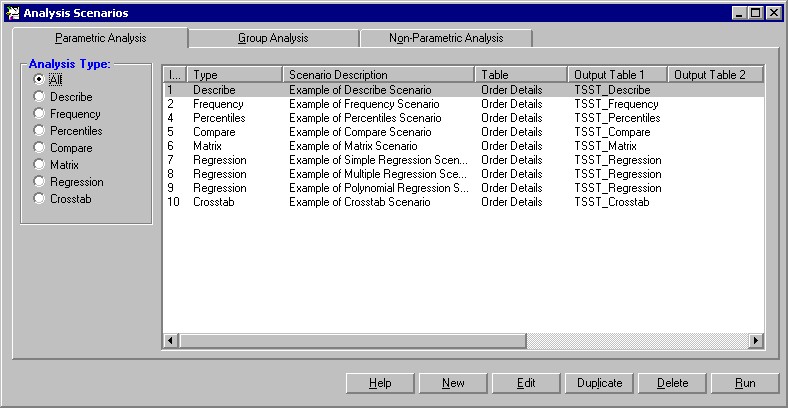
Scenario Designer
The Total SQL Statistics Scenario Designer is where you create
analysis scenarios. Scenarios contain information on the data to
analyze and the statistical options to perform. A Wizard-like
interface guides you through the process with no programming required.
This allows you to perform powerful analysis with point-and-click
ease. Your selections are automatically saved as "scenarios" which can
be run interactively or invoked programmatically.
Total SQL Statistics adds three small tables in your SQL Server
database to store these scenarios.
Programmatic Interface
Total SQL Statistics includes a programmatic interface for
programmers who want to incorporate statistical functions directly
into their applications. A DLL is all that is needed to add Total SQL
Statistics to your applications—simply reference our DLL with the
scenario you designed in the Scenario Designer, and the results are
generated. You can specify all login information and direct output
tables to a different database. While the analysis is running, events
are available to let you know its progress. The analysis runs in the
background, so your users won’t even know how you generate the complex
analysis!
Total SQL Statistics is .Net Ready!
Total SQL Statistics supports Microsoft’s .Net platform. You can
create Visual Studio .Net projects and include a reference to the
Total SQL Statistics Runtime DLL just as you would in Visual Basic 6.
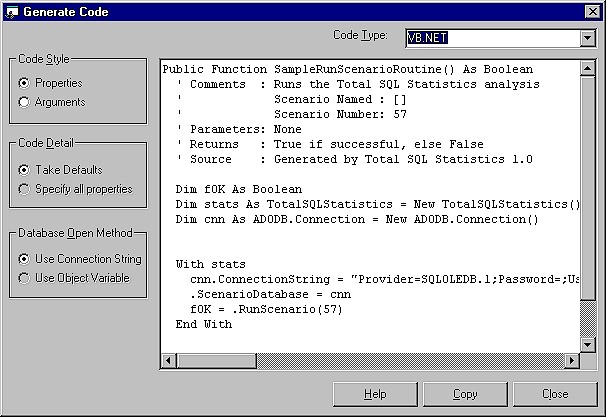
The Total SQL Statistics Code Generator makes it easy to insert the
Visual Basic, VB .Net or C# code to run any scenario you define.
General Features
Total SQL Statistics includes a complete set of features to make it easy
to add powerful data analysis to SQL Server projects.
| Feature |
Benefit |
| Interactive Scenario Designer |
Create, test, and fine-tune statistical
analysis interactively using a Wizard-like application. All scenarios
are automatically saved for re-use or modification. |
| Programmatic interface |
Easily add statistical analysis of SQL
Server data to your Visual Basic and VB .Net projects. A hidden
interface lets you run Total SQL Statistics while controlling what the
user sees. |
| Accuracy |
All calculations are in double precision
(15 digits accuracy) |
| Platform Support |
Runs on any network or operating system
that supports SQL Server. |
| Multi-user ready |
Multiple users can run an application that
uses Total SQL Statistics at the same time. |
| Royalty-Free License |
Each license allows a developer to include
Total SQL Statistics in applications distributed to an unlimited number
of customers. |
| Small DLL |
Only one small file, a statistics ActiveX
DLL under 1 MB in size, is added to your applications. |
Data Analysis Features
| Feature |
Benefit |
| Analyze SQL Server Data |
Total SQL Statistics offers functions to
analyze data stored in SQL Server tables, views, stored procedures, and
user defined functions that return data. |
| Results in SQL Server tables |
Rather than a large number of statistical
functions, each returning one value, Total SQL Statistics generates many
values at once. Each value is stored in a separate record and field in a
table, making it easy for you to view, sort, query, or display the
results. |
| Analyze Large Data Sets |
Multiple fields and an unlimited number of
records can be analyzed at one time. |
Group Data
(optional) |
For every unique combination of values in
the specified group fields, a separate calculation is generated. For
instance, grouping on a State field generates separate results for each
state (stored as individual records in the output table). |
Ignore Values
(optional) |
Specify specific values or ranges of values
to omit. For instance, 999 is sometimes entered as an "unknown" value
and must be ignored. |
Weighting Field
(optional) |
Specify a weighting field to perform
calculations such as weighted averages, weighted standard deviations,
weighted regressions, etc. |
Statistical Functions
The statistical functions are grouped into three categories: Parametric,
Group, and Non-Parametric.
Parametric Analysis Options
Parametric analysis is performed on numeric fields that are assumed to be
continuous and normally distributed. Fields are analyzed individually or
compared with each other.
| Type |
Description |
| Describe |
Analysis of a numeric field: std.
deviation, std. error, variance, coefficient of variance, skewness,
kurtosis, geometric mean, harmonic mean, RMS, mode, confidence
intervals, t-Test vs. mean, percentiles, etc. |
| Frequency |
For each field, frequency distribution
analysis for each interval (range of values): count, sum, percent of
total, cumulative count, percent, and sum. |
| Percentiles |
Median, quartiles, quintiles, deciles, and
percentiles. Similar to Describe, but results placed in records rather
than fields (each percentile is a record). |
| Compare |
Compare two fields: mean and standard
deviation of difference, correlation, covariance, R-square, paired
t-Test. |
| Matrix |
Similar to Compare, but rather than several
fields compared to one, all fields are compared to each other creating a
matrix. |
| Regression |
Simple, multiple, and polynomial
regressions with coefficient analysis, ANOVA, and residual table. |
| Crosstab |
Cross-tabulation with row and column
summaries, and % of row, column, and total for each cell. Chi-Square
analysis is also available with expected value and % of expected for
each cell. |
Group Analysis Options
Group analysis is the comparison of continuous, normally
distributed numeric data between groups of records. A comparison field
in the table defines the groups. For instance, you may want to compare
data between men and women, or by race. Groups are usually of
different sizes (number of records) unlike the Compare feature in
Describe, which is for paired values.
| Type |
Description |
| Two Sample t-Test |
Two Sample t-Test compares means between
two groups of records. Calculations include pooled and separate t-values
for the two groups. |
| ANOVA |
Analysis of variance compares the means of
multiple groups of records. Calculations include degrees of freedom, sum
of squares within and between groups, F-value, and probability. |
| Two way ANOVA |
Two-way analysis of variance compares
multiple fields between groups of records. Same results as ANOVA with
additional values for each additional field. Used to measure relative
impact of each variable on the mean. |
Non-Parametric Options
Less powerful than parametric analysis, non-parametric analysis is
used when the underlying data is not continuous, for instance ordinal
data, or not normally distributed. Non-parametric analysis makes no
assumption on the distribution of the underlying data, since the
results are based on the ranks of the data. Non-parametric analysis
can be made for each numeric field individually, compared with each
other, or between groups of records (samples).
| Type |
Description |
| Chi-Square |
One sample Chi-Square. Evaluates
distribution and expected value for each unique value in a field. |
| Sign Test |
One sample sign test versus median, mean or
user defined value. |
| K-S Fit |
Goodness of Fit tests to determine if a
numeric field fits a uniform, normal, or Poisson distribution. |
| 2 Sample |
Two sample tests: Wald-Wolfowitz Runs Test,
Mann-Whitney U Test, and Kolmogorov-Smirnov. |
| N Sample |
Kruskal-Wallis one way ANOVA. |
| Paired Fields |
Field comparisons: paired sign test,
Wilcoxon Signed Rank, Spearman’s Rho correlation. |
| N Fields |
Friedman’s two way ANOVA. |
Probability Calculator
Evaluate the probability of test values (Z, t-Test, Chi-Square, and
F-value) for any degrees of freedom, or the inverse (test value for a
given probability). This calculator eliminates the hassles of
interpolating values in references tables common in the back of
statistics books.
How Total SQL Statistics Works
Before using Total SQL Statistics programmatically, you should
understand how it works, and where it keeps its scenario settings.
Total SQL Statistics consists of a design-time component (the
Scenario Designer) and a redistributable run-time component (the
calculation engine). When you create and test an analysis scenario
with the Scenario Designer, you are working with the same calculation
engine that is distributed with your application.
The Scenario Designer is the interactive component (FMSSTAT.EXE)
used to set up the scenarios. This component may not be distributed.
The calculation engine has no user interface. It is used purely to
perform calculations and work with the tables created by the Scenario
Designer. It exposes several public functions that you can call from
your application to generate the analyses dynamically at runtime
(RunScenario, Probability, and Inverse Probability functions).
Programmatic Overview
This section describes the programmatic interface of Total SQL
Statistics. It assumes that you are familiar with using Visual Basic
or Visual Studio .Net and invoking functions.
Prior to using the programmatic interface, you must create the
scenarios with the Scenario Designer. Run your scenario in the
Scenario Designer before adding it to your program to verify that it
works.
Total SQL Statistics includes three functions to let you add its
features inside your application:
-
RunScenario
Run any saved scenario
-
Probability
Calculate probability as used in the Probability Calculator
-
Probinverse
Calculate inverse probability as used in the Probability
Calculator
Important Concepts
There are several important concepts you should be familiar with
before installing and using Total SQL Statistics:
-
The analysis is performed on the tables, views, stored
procedures, and user defined functions in your SQL Server database.
Total SQL Statistics supports stored procedures and user defined
functions that return data, specifically stored procedures that
return only one recordset, and table-type user-defined functions.
-
Three tables are used to store scenario settings. These tables
are added to every database that you open with the Scenario
Designer. The information remains with your database even if you
rename the database, move it, or re-install Total SQL Statistics.
-
Your analysis selections (scenarios) are automatically saved for
reuse. Only the settings are saved, not the data, so the latest data
is always used to recalculate the results when you run a scenario.
-
Your data is never modified. Total SQL Statistics only reads and
sorts your data. When it needs to process intermediate data, it is
created in separate temporary tables that are deleted after the
analysis is completed.
-
Multiple fields can be analyzed at one time.
-
Groups of records can be analyzed simultaneously, similar to how
the "Group By" clause works in T-SQL.
-
Records can be weighted by assigning a weighting field to
designate the number of times the record is counted.
-
Null values are automatically ignored. You can also specify
specific values or ranges of values to ignore.
-
The results are placed in tables in the current database or
another database you specify. These tables can be shared by everyone
or specified as local temp tables for each user in a multi-user
environment.
System Requirements
The system requirements for Total SQL Statistics are:
-
Pentium II processor or better
-
Microsoft Windows XP, Windows 2000, Windows 98, Windows
Millennium Edition (ME), or Windows NT 4.0 (Service Pack 6 or
higher).
-
128 MB RAM
-
10 MB of hard disk space
-
Microsoft Visual Basic 5.0, 6.0, or Visual Studio .NET.
-
Microsoft Data Access Components (MDAC), version 2.5 or higher
(available at
www.microsoft.com/data)
Purchasing Options
|
|