 Creating an Annual 12 Month Summary Report without VBA Code by Creatively Using a Microsoft Access Crosstab Query
Provided by Luke Chung, President of FMS, Inc.
A well designed database stores data in a normalized format with dates defined in a field so that new data is simply added as additional records. However, people want to see data with dates grouped by columns. How can we do this for any 12 month period, and do it without writing any code?
This paper shows an easy way to display monthly summaries for any 12 month period in a report without any code.
A sample database is included to show how this is done: Download (189K)
Here's an example using the Orders data from the old Northwind database showing monthly sales by country. Each country is a separate row, each month is a separate column, and column totals are shown at the bottom:

Example of a 12-month Report for Any Date Range (sorry for the data from the 1990's as that's what was in the Microsoft table)
The user can specify the starting month of the report and automatically show 12 months of data. The column titles show the year and month. If there is no data for a particular month, the report still shows the column with no data under it.
Data Storage is Different from the Way It Needs to be Displayed
Databases store data optimally in normalized, tabular manner. One sign of a good database design is that as time passes, new fields never need to be added. New dates, clients, contacts, etc. are just new records in the tables without the need to modify any table structures.
However, data often needs to be displayed in a "spreadsheet" or "matrix" format with different values in the columns such as a column for each month. Naturally, these columns change over time.
Crosstab Queries
Fortunately, Access crosstab queries make it easy to transform and summarize data from rows to columns. A crosstab lets you specify the field whose unique values are transformed to column fields and a value field to be summarized.
However, the columns of a crosstab query change based on the data in the selected column field (and can change over time). Additionally, if there is data missing for a particular column (or month in our example), the crosstab would not show that column. This creates problems if a report expects the column names to remain the same each time, or writing a lot of code to accommodate this.
Here's a quick introduction to crosstab queries. For more information, see the online Access help for crosstabs. Crosstab is one of the Microsoft Access Query Types:

Crosstab is a Microsoft Access Query Type
Unlike other query types, the Query Designer for Crosstabs has an extra Crosstab row to specify each of the columns. Columns can be a field or expression. This example shows a crosstab grouped by Country with columns for each month (defined as the year-month format of the [OrderDate]), and displaying total sales:

Design view of Crosstab query qryCountryMonthlySalesXTAB
When you run the query, the summarized sales displayed for each month as a separate column (some columns not displayed here):

Crosstab Query with Actual Month-Year as Columns
Microsoft Access reports reference field names directly. If we want to use a crosstab query as the RecordSource of a report, its column names should not change (unless we want to write a lot of code to handle that).
Fortunately, there's an easy way to make sure our crosstab query always generates 12 columns of monthly data even if the table doesn't have data for all 12 months.
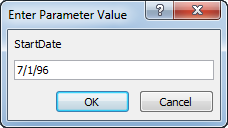
Take a look at the query qryCountryMonthlySalesDateXTAB with [StartDate] parameter in the criteria. This prompts the user for the date of the first month (e.g. 7/1/96) to define the 12 months we want to retrieve:

Query design of qryCountryMonthlySalesDateXTAB
Use Numbers Rather than Specific Month Names
In the original crosstab query qryCountryMonthlySalesXTAB, each month column is shown in yyyy-mm format. That makes it difficult for a report (or subsequent query) to use as the date range changes.
A better approach is to define each month as a number between 1 and 12, starting with the first month to display. This is defined in the ad hoc query qryCountryMonthlySalesDateXTAB.
The trick is to think of each month as a unique number starting from Year 0:
Year([OrderDate])*12+Format([OrderDate],"mm") -
(Year([StartDate])*12+Format([StartDate],"mm")) + 1
The equation defines each month as a number (Years * 12 + Month) and subtracts the StartDate month from the OrderDate month plus one. The result is a month number from 1 to 12 defining the months we want. The result is this:

Use the PIVOT IN Clause to Specify Required Column Names
Defining the month number is the first step and works great if you always have data for each month. However, if a month doesn't have any data, the crosstab won't create that field. We want to ensure every month from 1 to 12 exists.
This is accomplished by using the IN clause in the crosstab syntax. To do this, we need to edit the SQL string of the query and insert the IN clause. Here's the query:
PARAMETERS StartDate DateTime;
TRANSFORM Sum(([UnitPrice]*[Quantity]*(1-[Discount])/100)*100) AS Sales
SELECT Orders.ShipCountry FROM Orders
INNER JOIN [Order Details] ON Orders.OrderID = [Order Details].OrderID WHERE (((Orders.OrderDate)>=[StartDate]))
GROUP BY Orders.ShipCountry
PIVOT Year([OrderDate])*12+Format([OrderDate],"mm")-(Year([StartDate])*12+Format([StartDate],"mm"))+1
IN (1,2,3,4,5,6,7,8,9,10,11,12)
The important part is the last line highlighted in red. By adding the IN clause and listing the column names required, the crosstab always creates those columns. The IN clause also limits columns (e.g. month 13 and higher are not included).
With the crosstab defining each month as a set number, we simply reference those columns in the report:

Report design of rptSalesByMonth
Column Names
To label each column, we translate the month column based on the [StartDate] parameter with the Format property set to yyyy-mm. For instance:
- Column 1 is [StartDate]
- Column 2 is DateAdd("m",1,[StartDate])
- Column 3 is DateAdd("m",2,[StartDate])
- etc. to
- Column 12 is DateAdd("m",11,[StartDate])
The VBA DateAdd function when passed the "m" parameter adds the number of months to the [StartDate] to create the new date that the Format property is applied for display.
 The
result is a nicely formatted monthly summary report that adjusts to any starting month a user enters.
The
result is a nicely formatted monthly summary report that adjusts to any starting month a user enters.
The sample data is from Northwind which has OrderDate between July 1996 and May 1998. Preview the report and enter the StartDate:
You'll see the report shown at the beginning of this paper.
Automatically Handles Missing Months
If you enter 1/1/96 as the StartDate, you'll see the report also works without any data for the first part of the year. This is because of the IN clause in the crosstab:

Example of missing data as blank columns
If you want to show the column headings with Year-Month (e.g. 2018-Jan), then use the date format as "yyyy-mmm" to show the month abbreviation rather than the month number.
Here are other related resources for data analysis and crosstabs:
- If you're comparing spreadsheets to databases, read our paper Microsoft Access versus Microsoft Excel for Data Analysis and Reporting (spreadsheets vs. databases)
- To design tables that properly scale as your data changes over time, read our paper Microsoft Access and SQL Server Database Normalization Tips
- For advanced crosstab data analysis, read Microsoft Access Crosstab and Chi-Square with Total Access Statistics
- For additional developer tips, visit our Microsoft Access Developer and VBA Programming Help Center
The need for monthly summary reports is quite common. Hopefully, the techniques shown here will help you create richer Access reports and use crosstabs more efficiently, while giving you more ideas on creating new reports.
Good luck!
Luke Chung is the President and Founder of FMS, Inc., the world's leading provider of Microsoft Access third party products for users and developers.
Visit the FMS web site for additional Access resources, utilities, technical papers, demos, and product information.

 Query Blog
Retrieving Data
Action Queries
Statistical Analysis

The most popular Microsoft Access Number Cruncher
Source Code Library

SQL Server Upsizing

Microsoft Access to SQL Server Upsizing Center
Additional Resources
Connect with Us
 Email Newsletter
 Developer Team Blog
 Facebook
 X/Twitter


