 Show Data Trends with Tiny Sparkline Charts in Microsoft Excel 2010
Provided by Molly Pell, Senior Systems Analyst
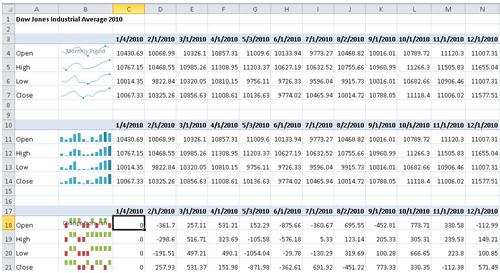
A new feature in Microsoft Excel 2010 lets you insert tiny charts, or Sparklines, into worksheet cells. Sparklines are a powerful way to show a quick snapshot of data trends.
To insert a Sparkline:
- Select the cell where you want to insert the mini chart.
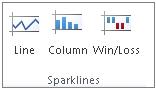
- On the Insert tab of the Ribbon, choose the desired Sparkline type in the Sparklines group:
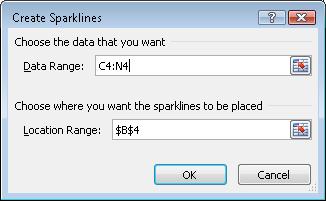
- In the Data box, type the range of the cells that contain the data on which to base the Sparkline:
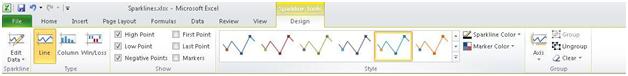
After you insert the Sparkline, a new tab appears on the Ribbon. The Sparkline Tools tab allows you to select from a variety of formatting options, including the chart type, colors and styles, etc.
Click to download sparklines.zip (10.K)
Microsoft Resource
 Additional
Resources for Microsoft Office 2010
Additional
Resources for Microsoft Office 2010
Multiple Microsoft Office 2010 Products
- Quickly Insert Screenshots in Microsoft Excel, Outlook, PowerPoint and Word 2010
- Recover unsaved documents or return to an earlier version of your document in Microsoft Excel, PowerPoint, and Word 2010
 Microsoft
Excel
Microsoft
Excel
 Microsoft
PowerPoint
Microsoft
PowerPoint
Connect with Us
 Email Newsletter
 Developer Team Blog
 Facebook
 X/Twitter
Additional Resources
 My FMS
Thank you! Thank you! I just finished reading this document, which was part of a link in the recent Buzz newsletter. I have printed it for others to read, especially those skeptical on the powers of Access and its capabilities.
Darren D.
 All Our Microsoft Access Products


